HTMatplotLib
Bar
Line
Pie
Scatter
Multi-Bar
Multi-Line
About
Contact
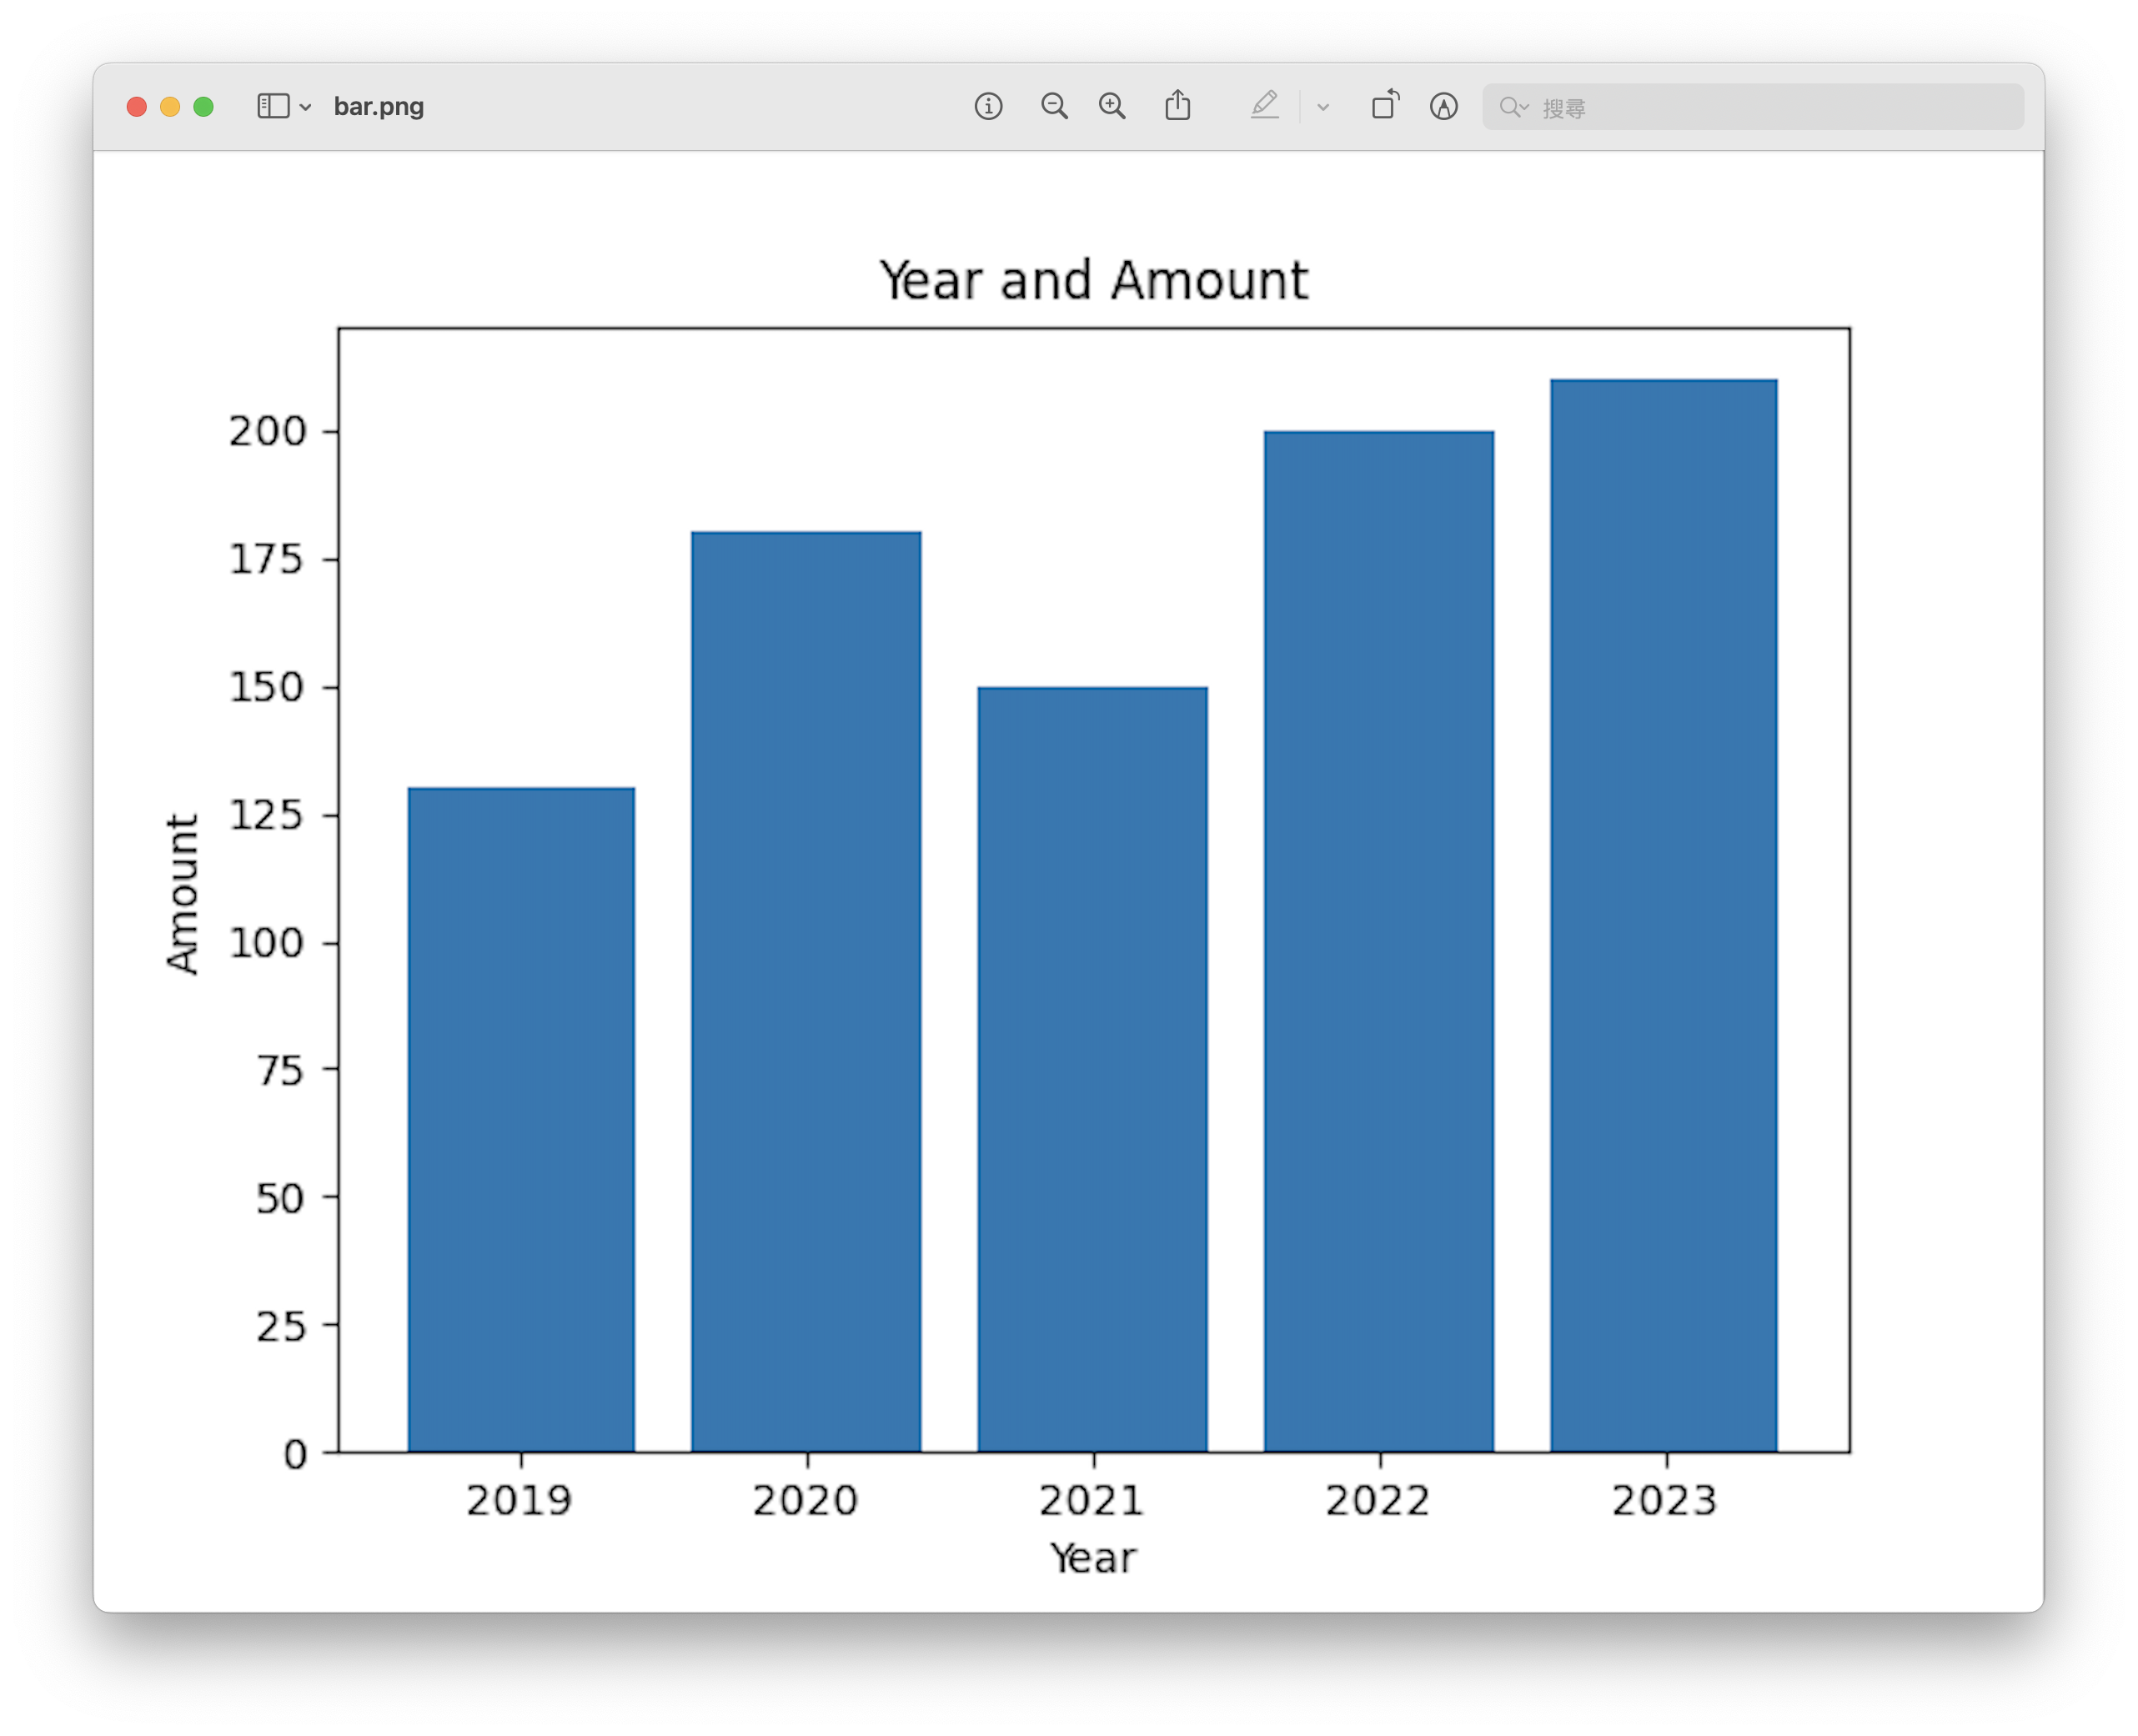
Bar Chart
A graphical representation using rectangular bars to compare different categories or groups.
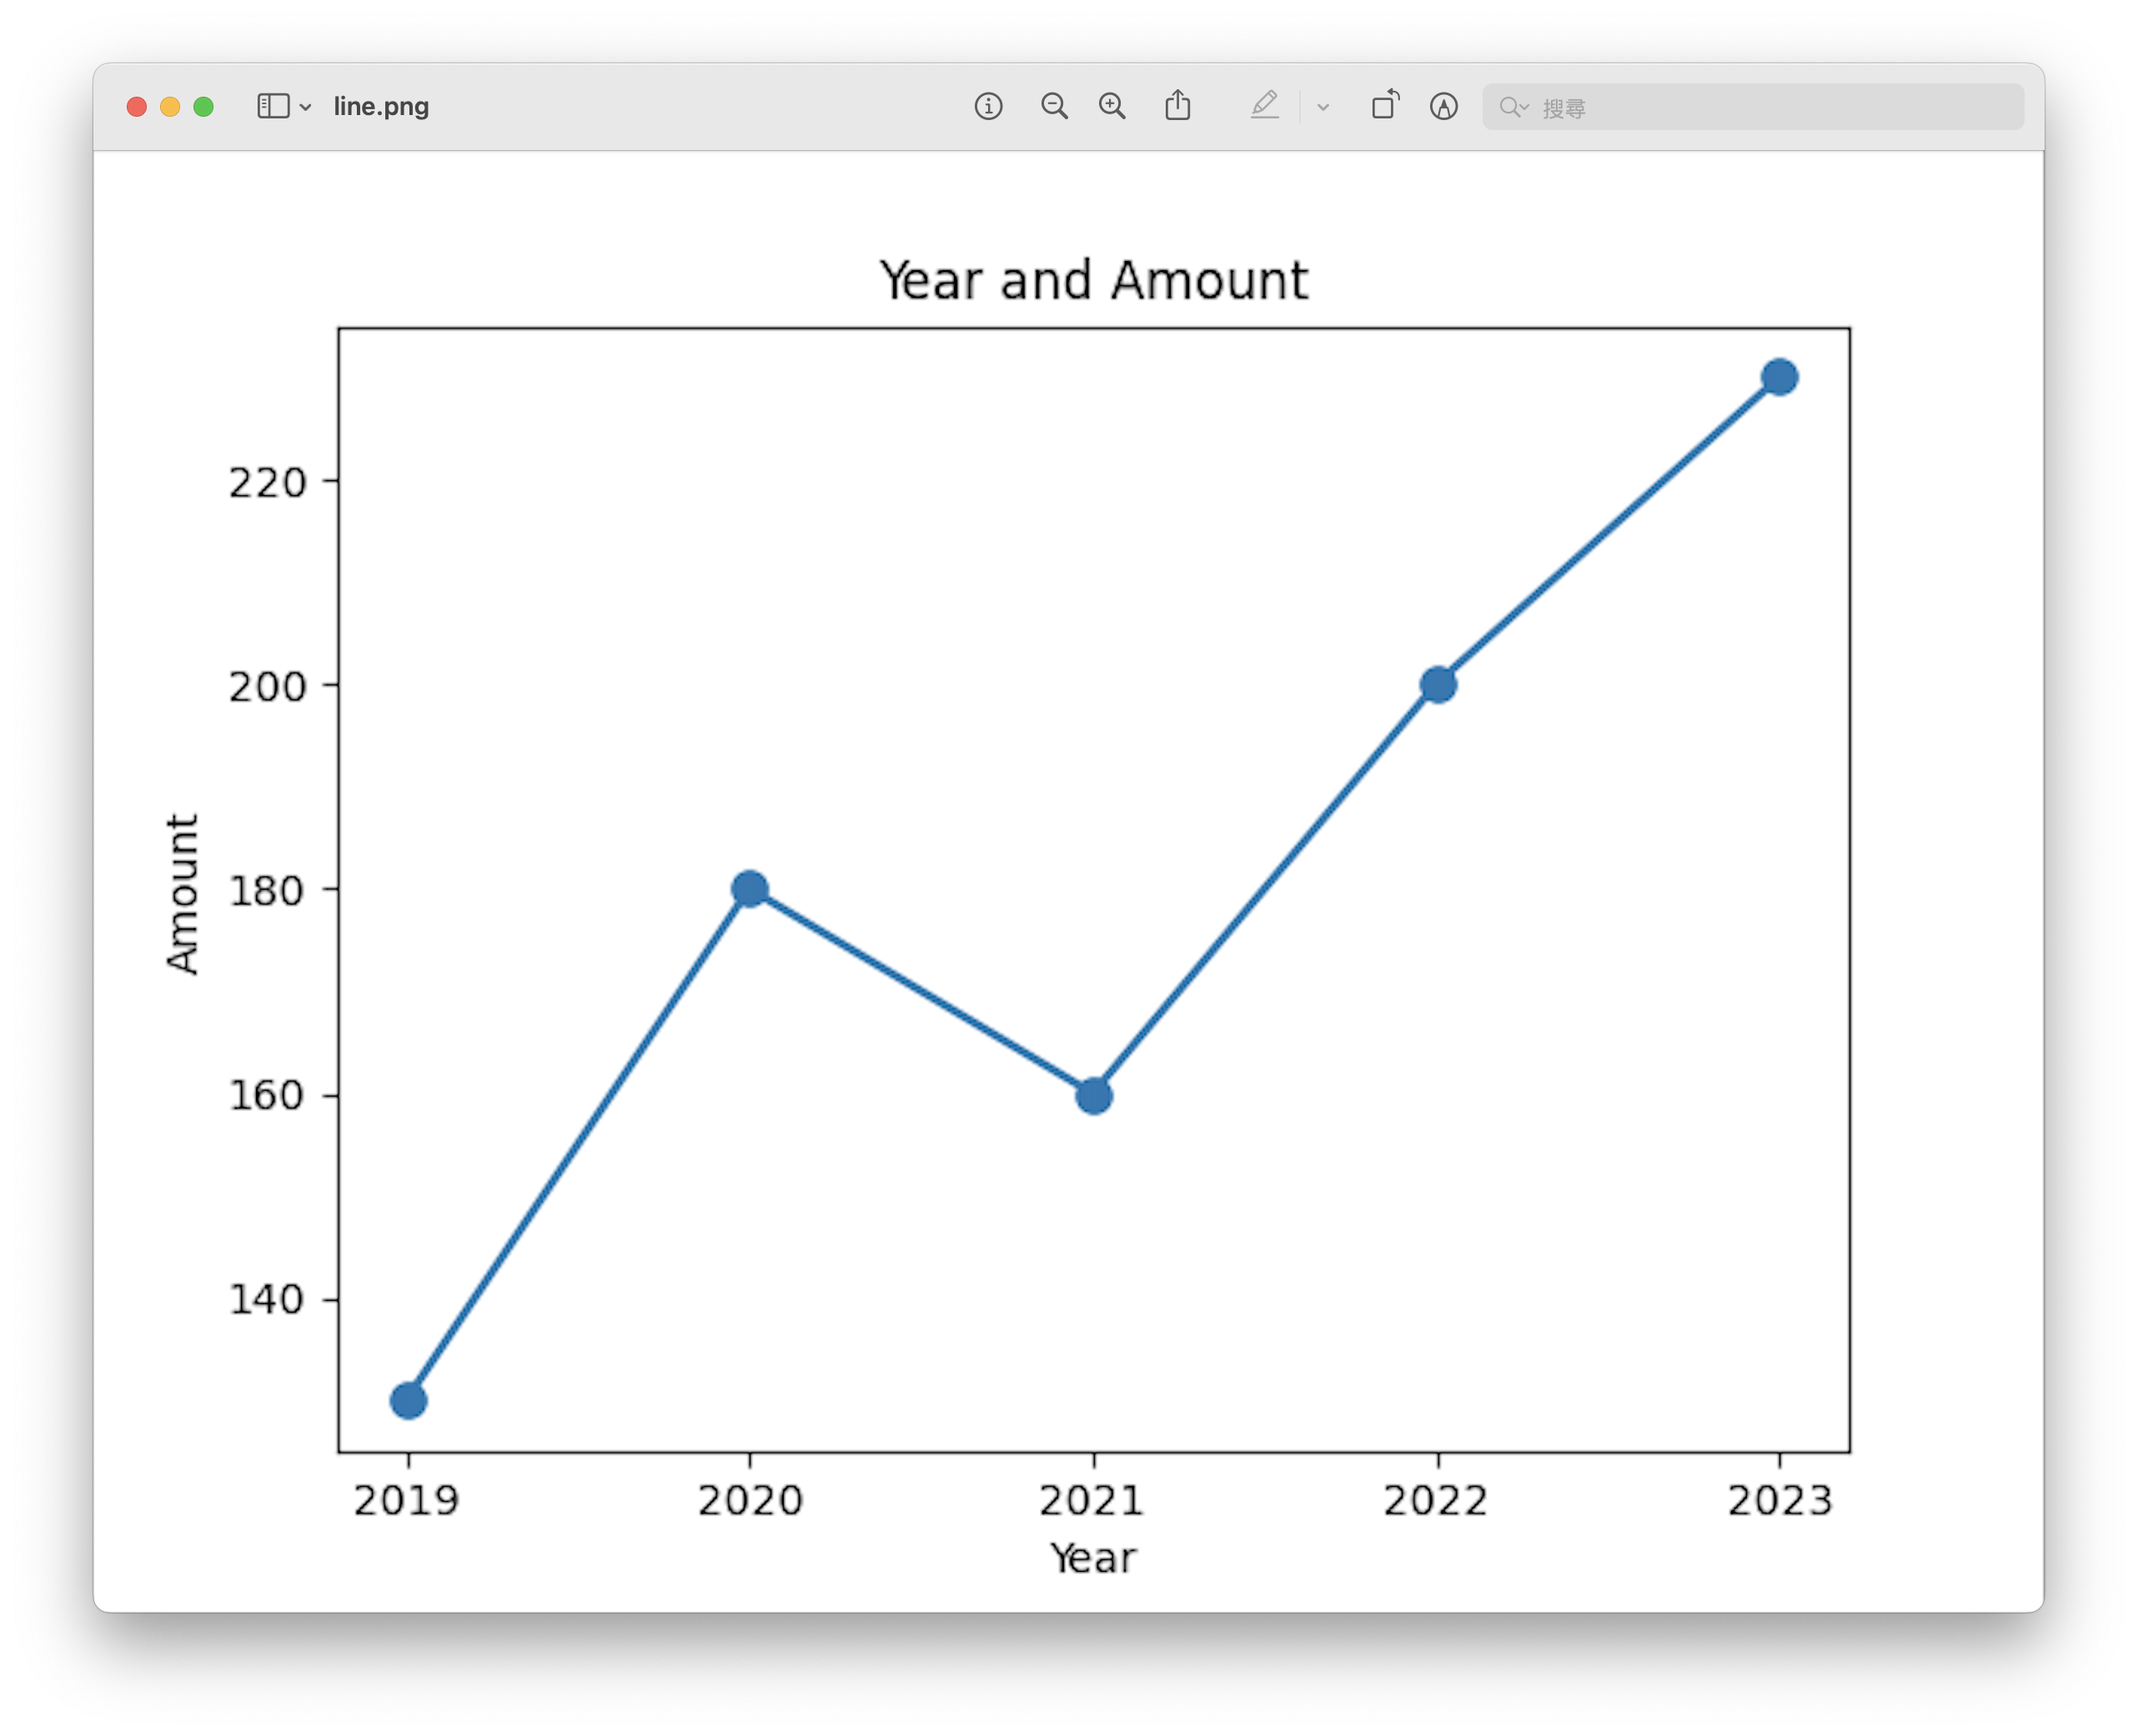
Line Chart
A visual representation showing the relationship or trend between two variables over time or a continuous interval.
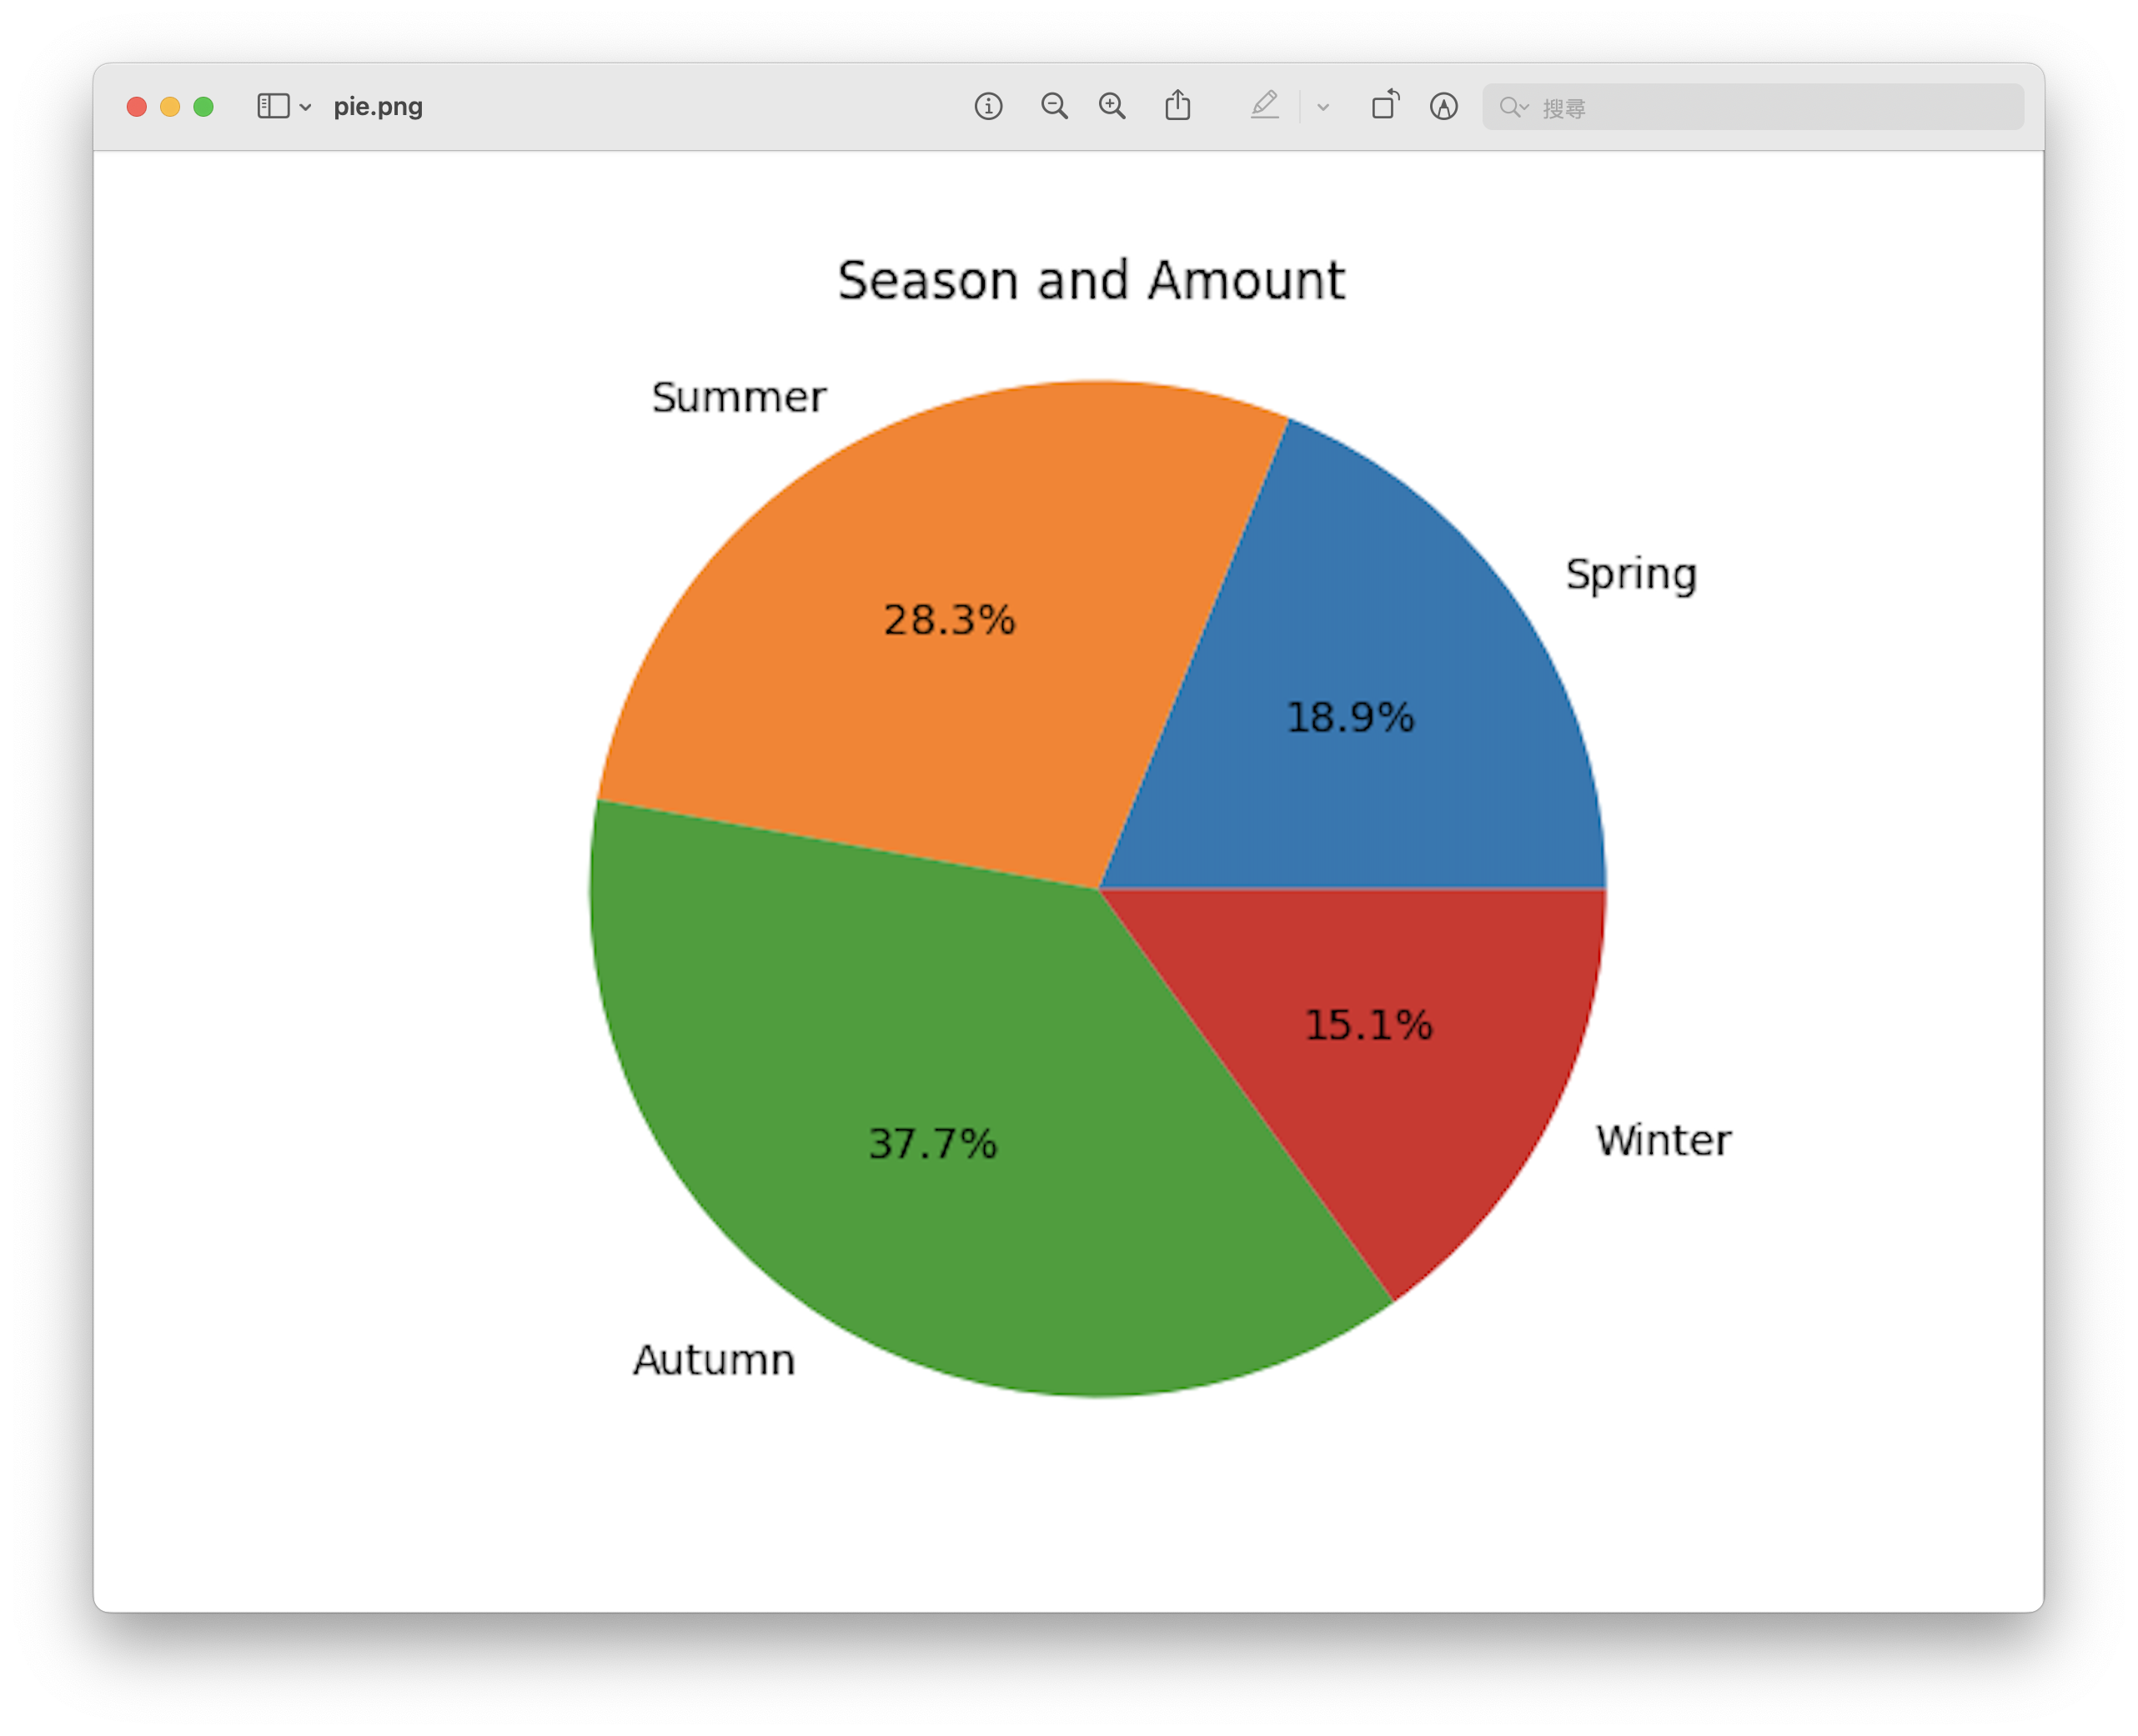
Pie Chart
A circular graph that illustrates the proportion or percentage of different categories within a dataset.
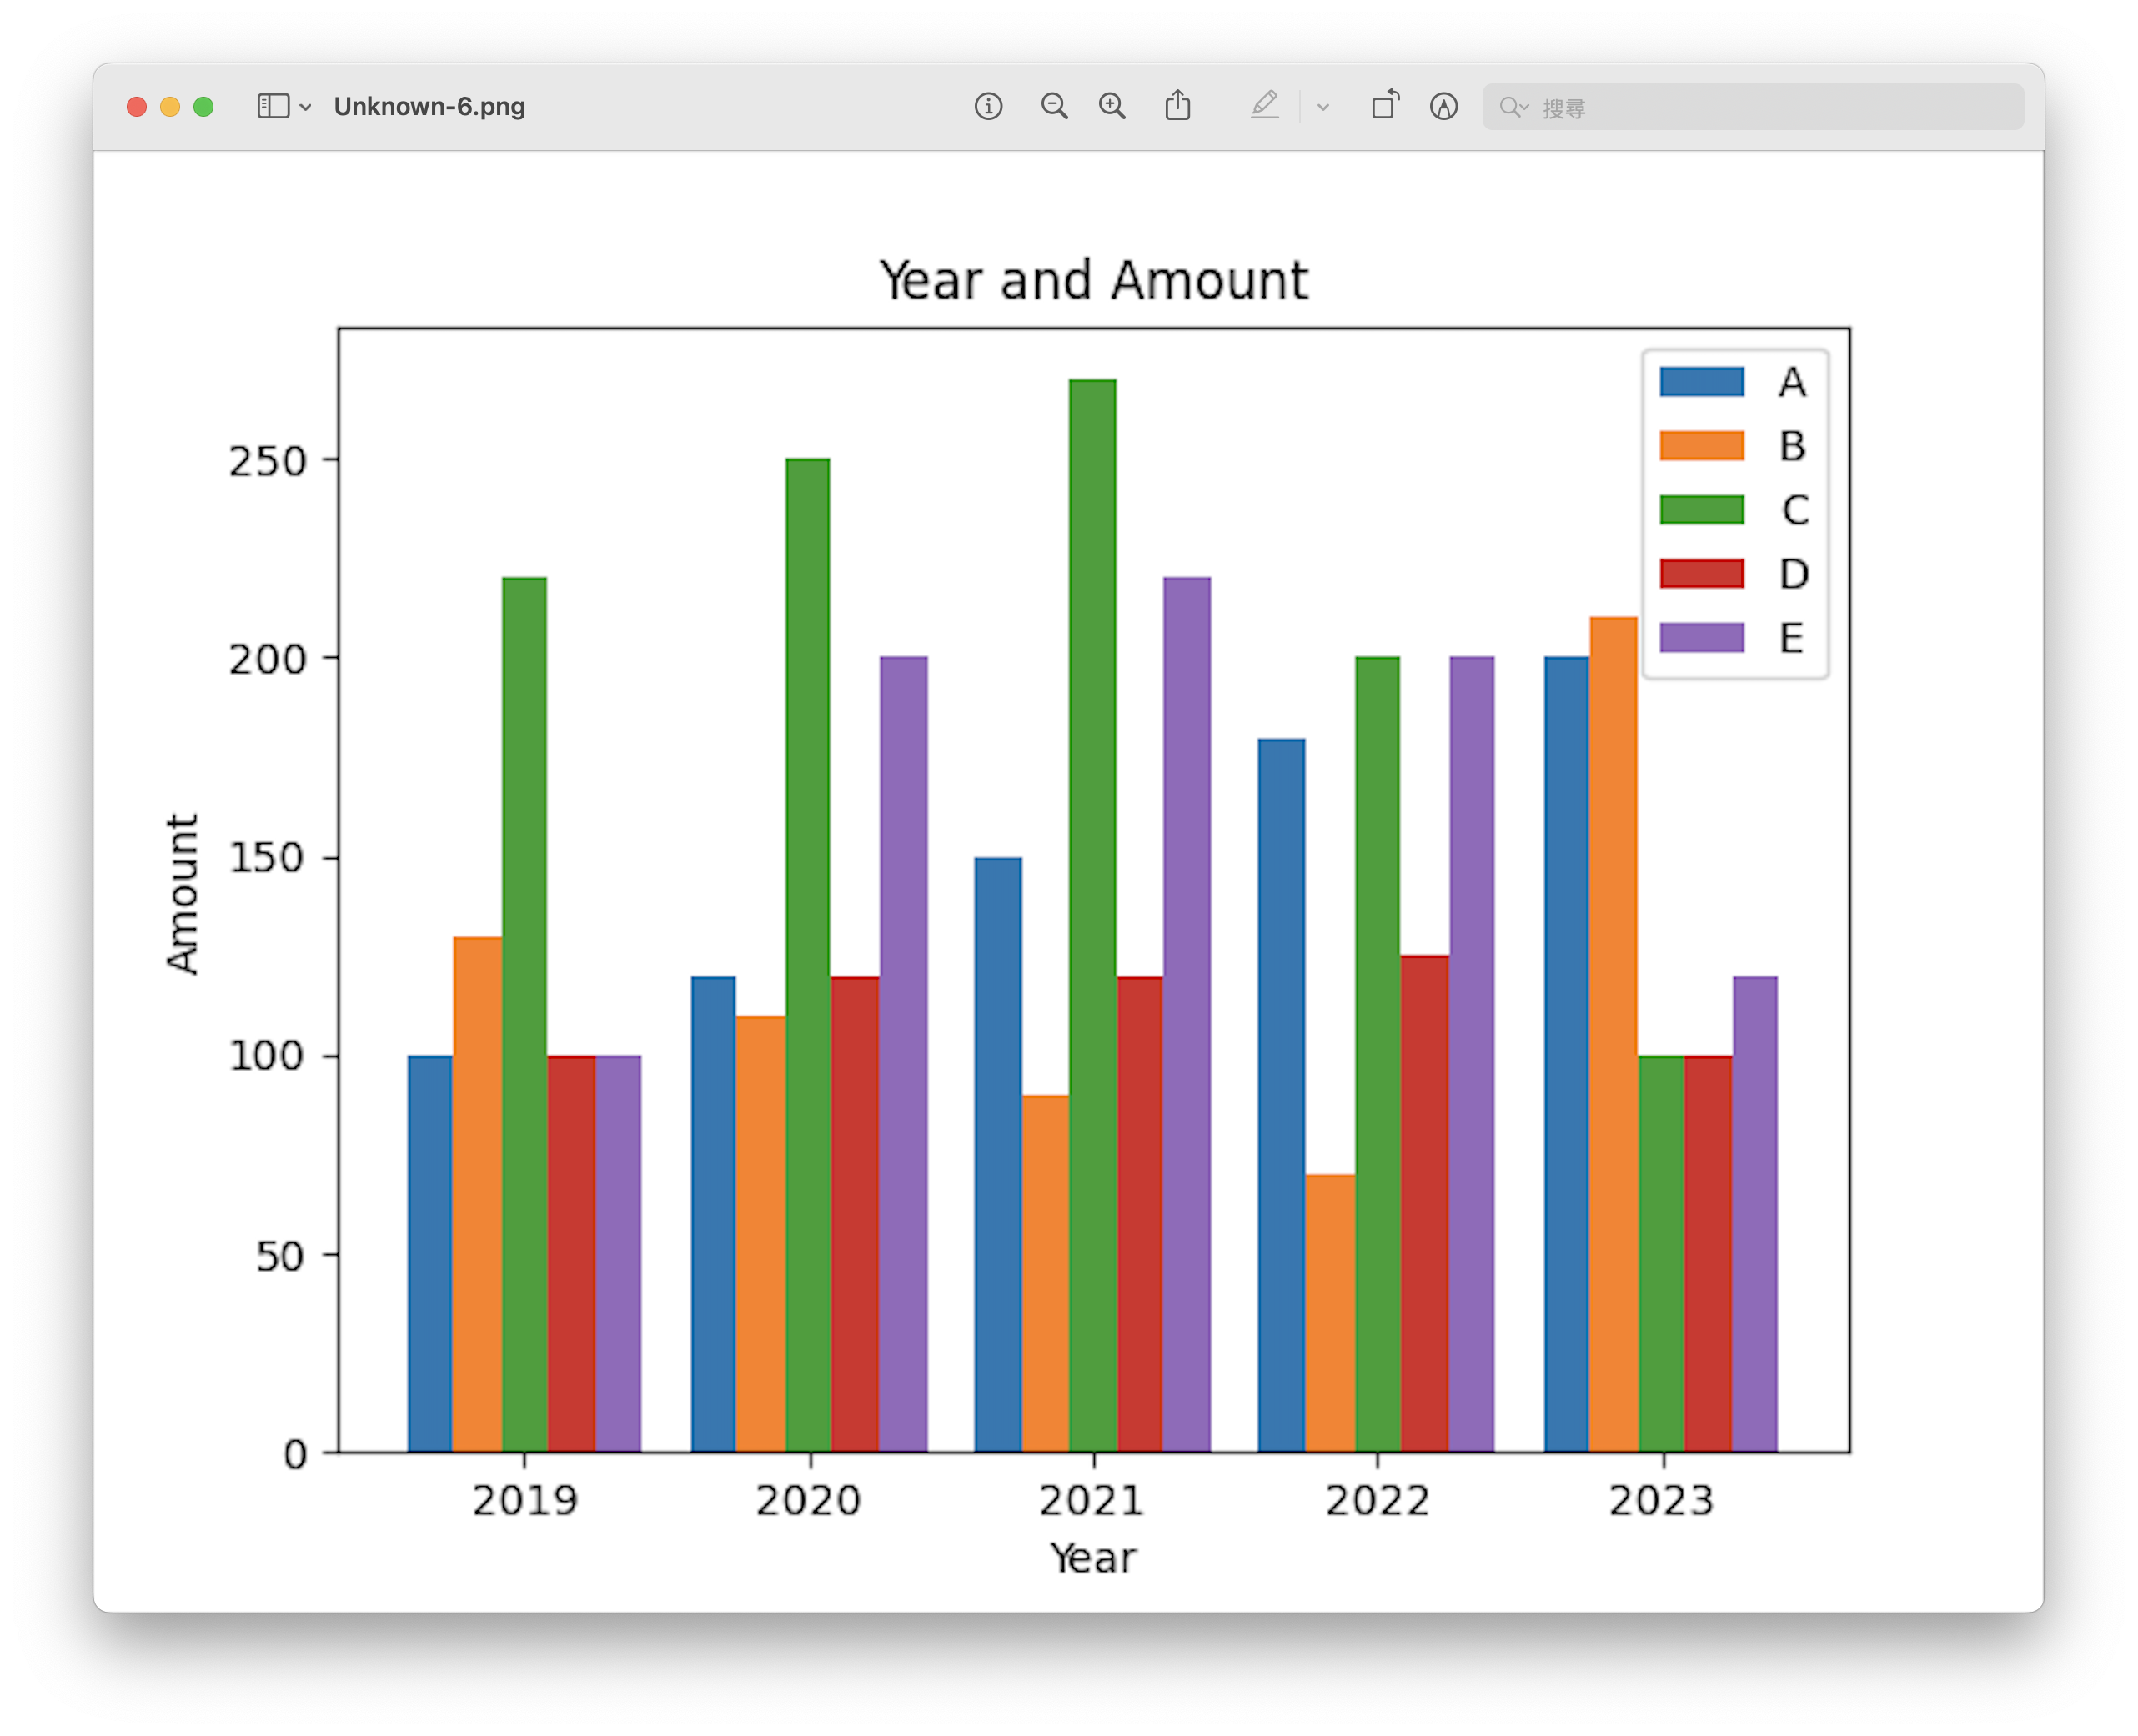
Multi-Bar
Compare with different data. Showing them together with bar chart.
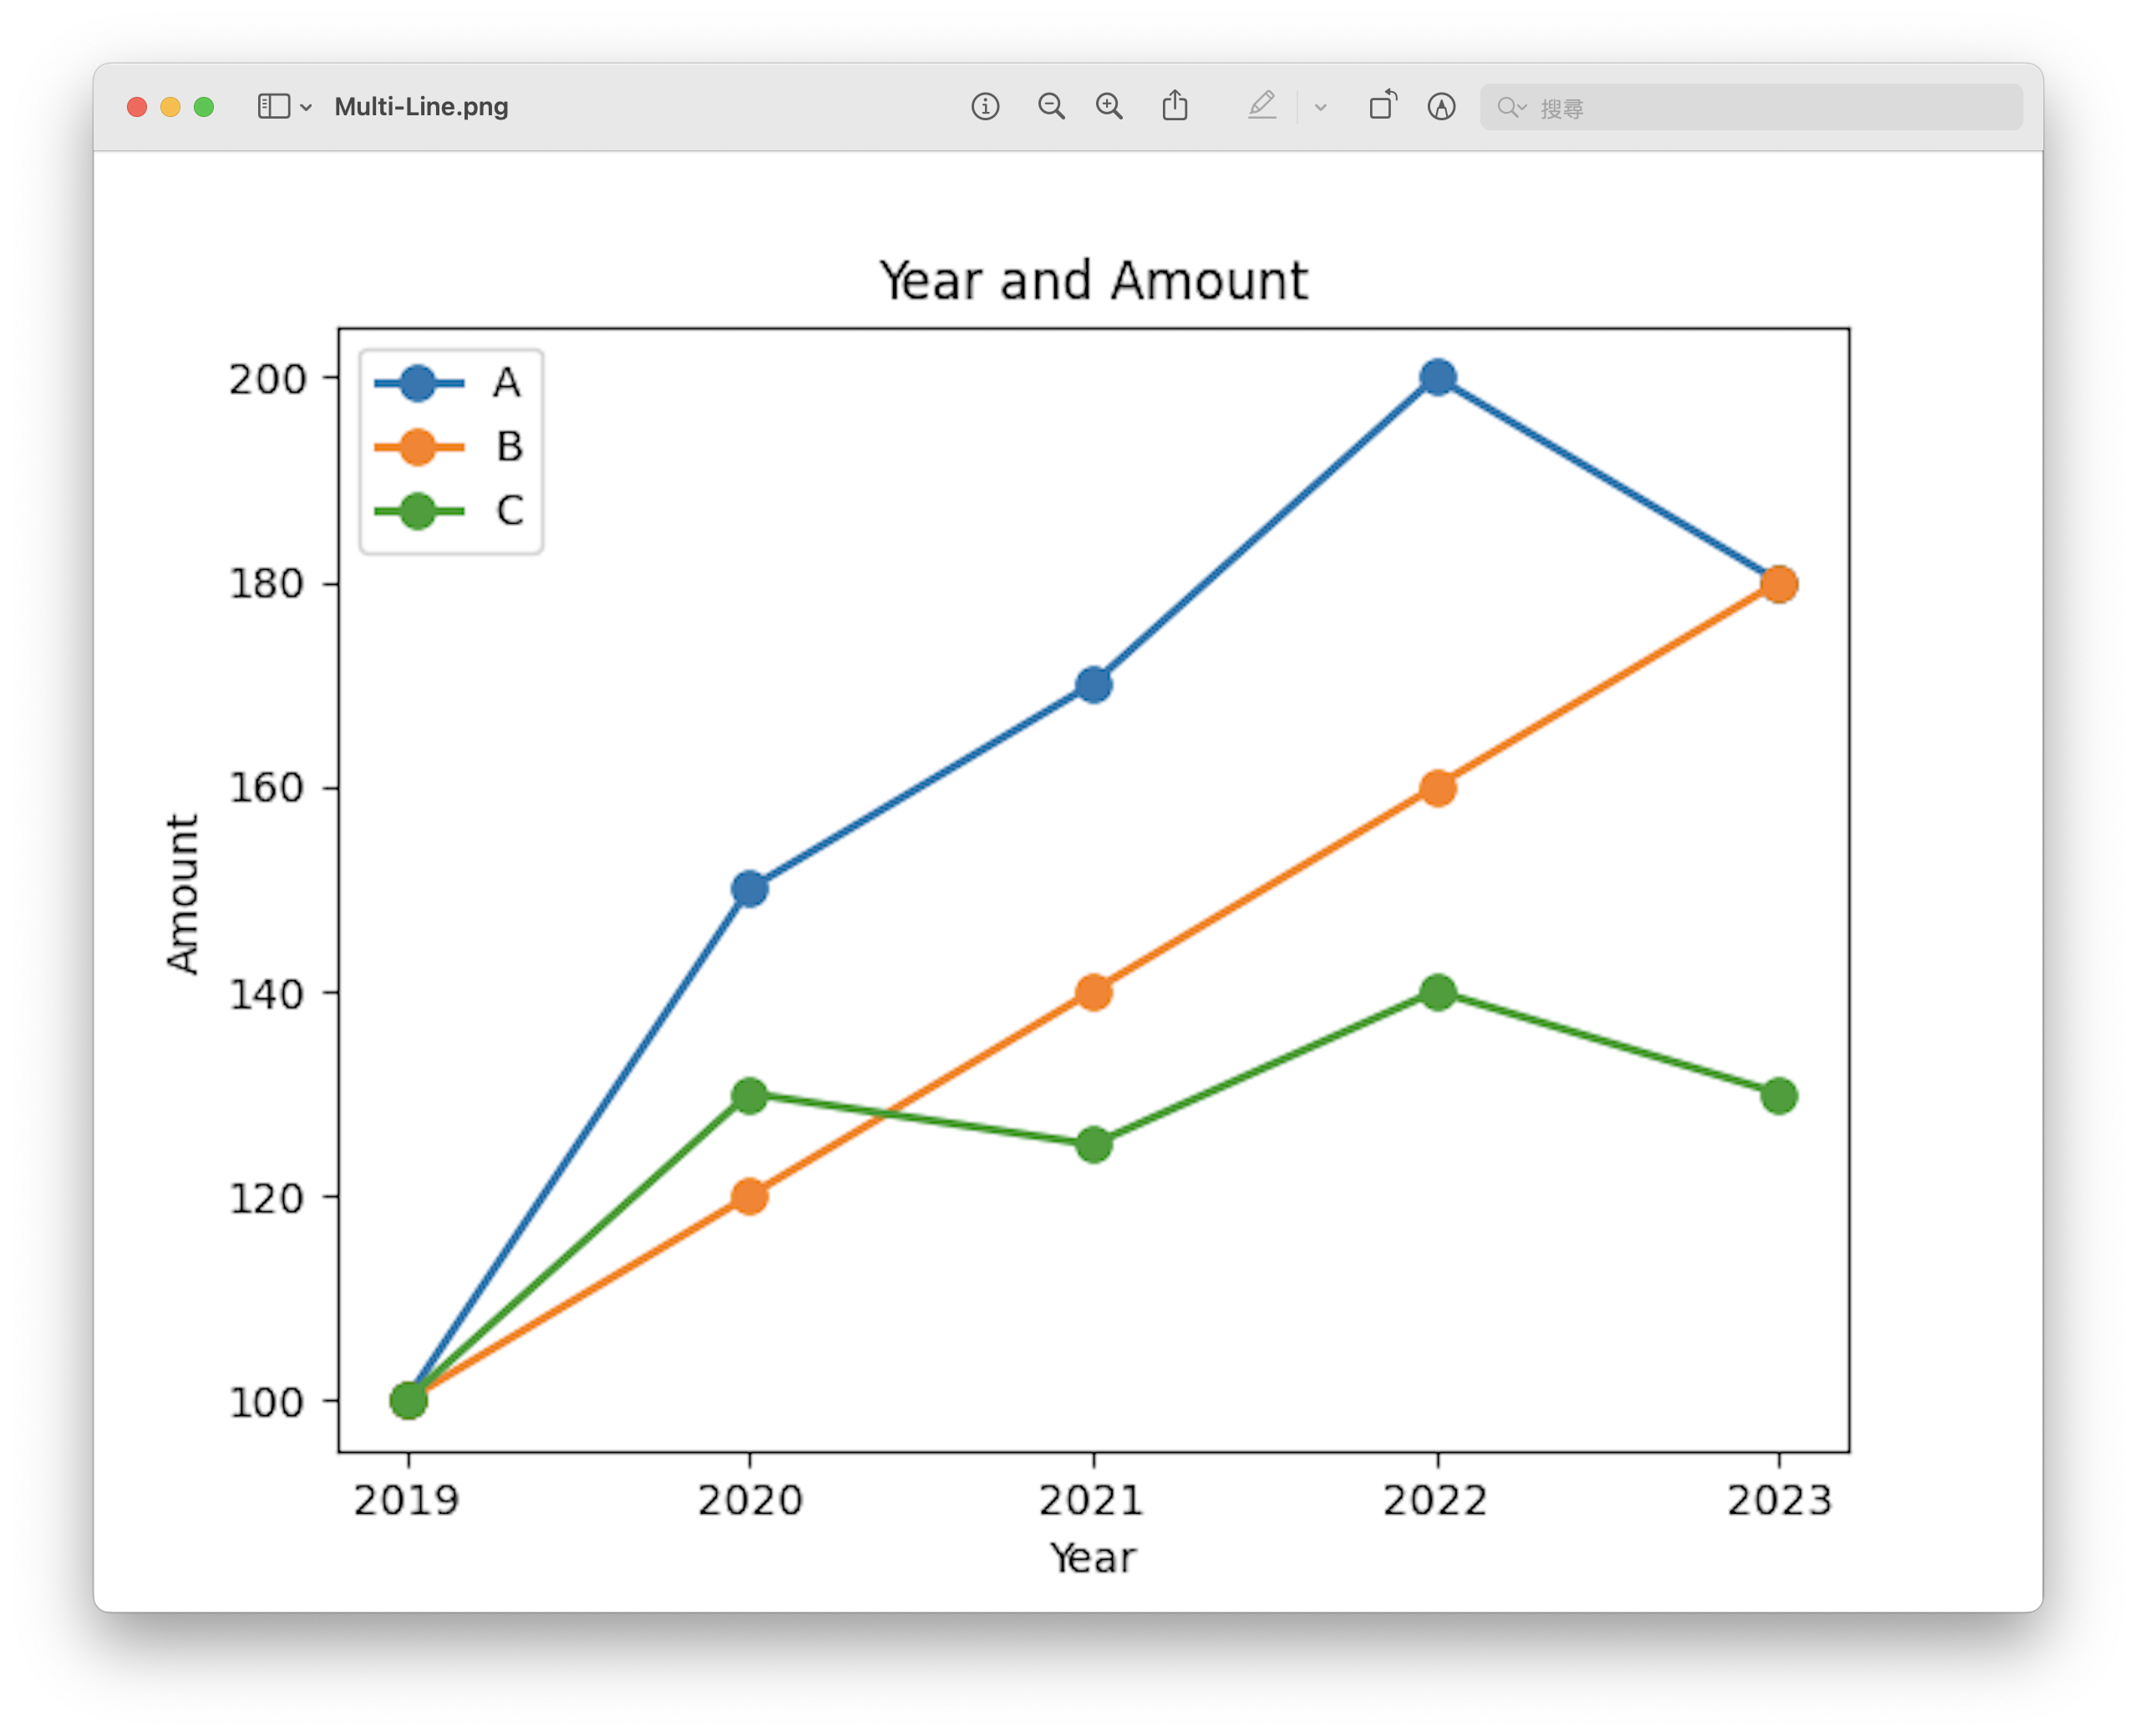
Multi-Line
Compare with different data. Showing them together with line chart.